
Short answer: Amsterdam. Its sewage carried the most cannabis residue of any European city tested in spring 2025: 194.1 mg per 1,000 people a day, even after a 39% fall from 2024.
German cities fill the next four places: Erfurt, Berlin, Hamburg and Nuremberg.
The lowest levels are in Ankara and Istanbul, about 13 times below Amsterdam.
Data: EU drugs agency (EUDA) and the SCORE network, 82 cities in 18 countries.
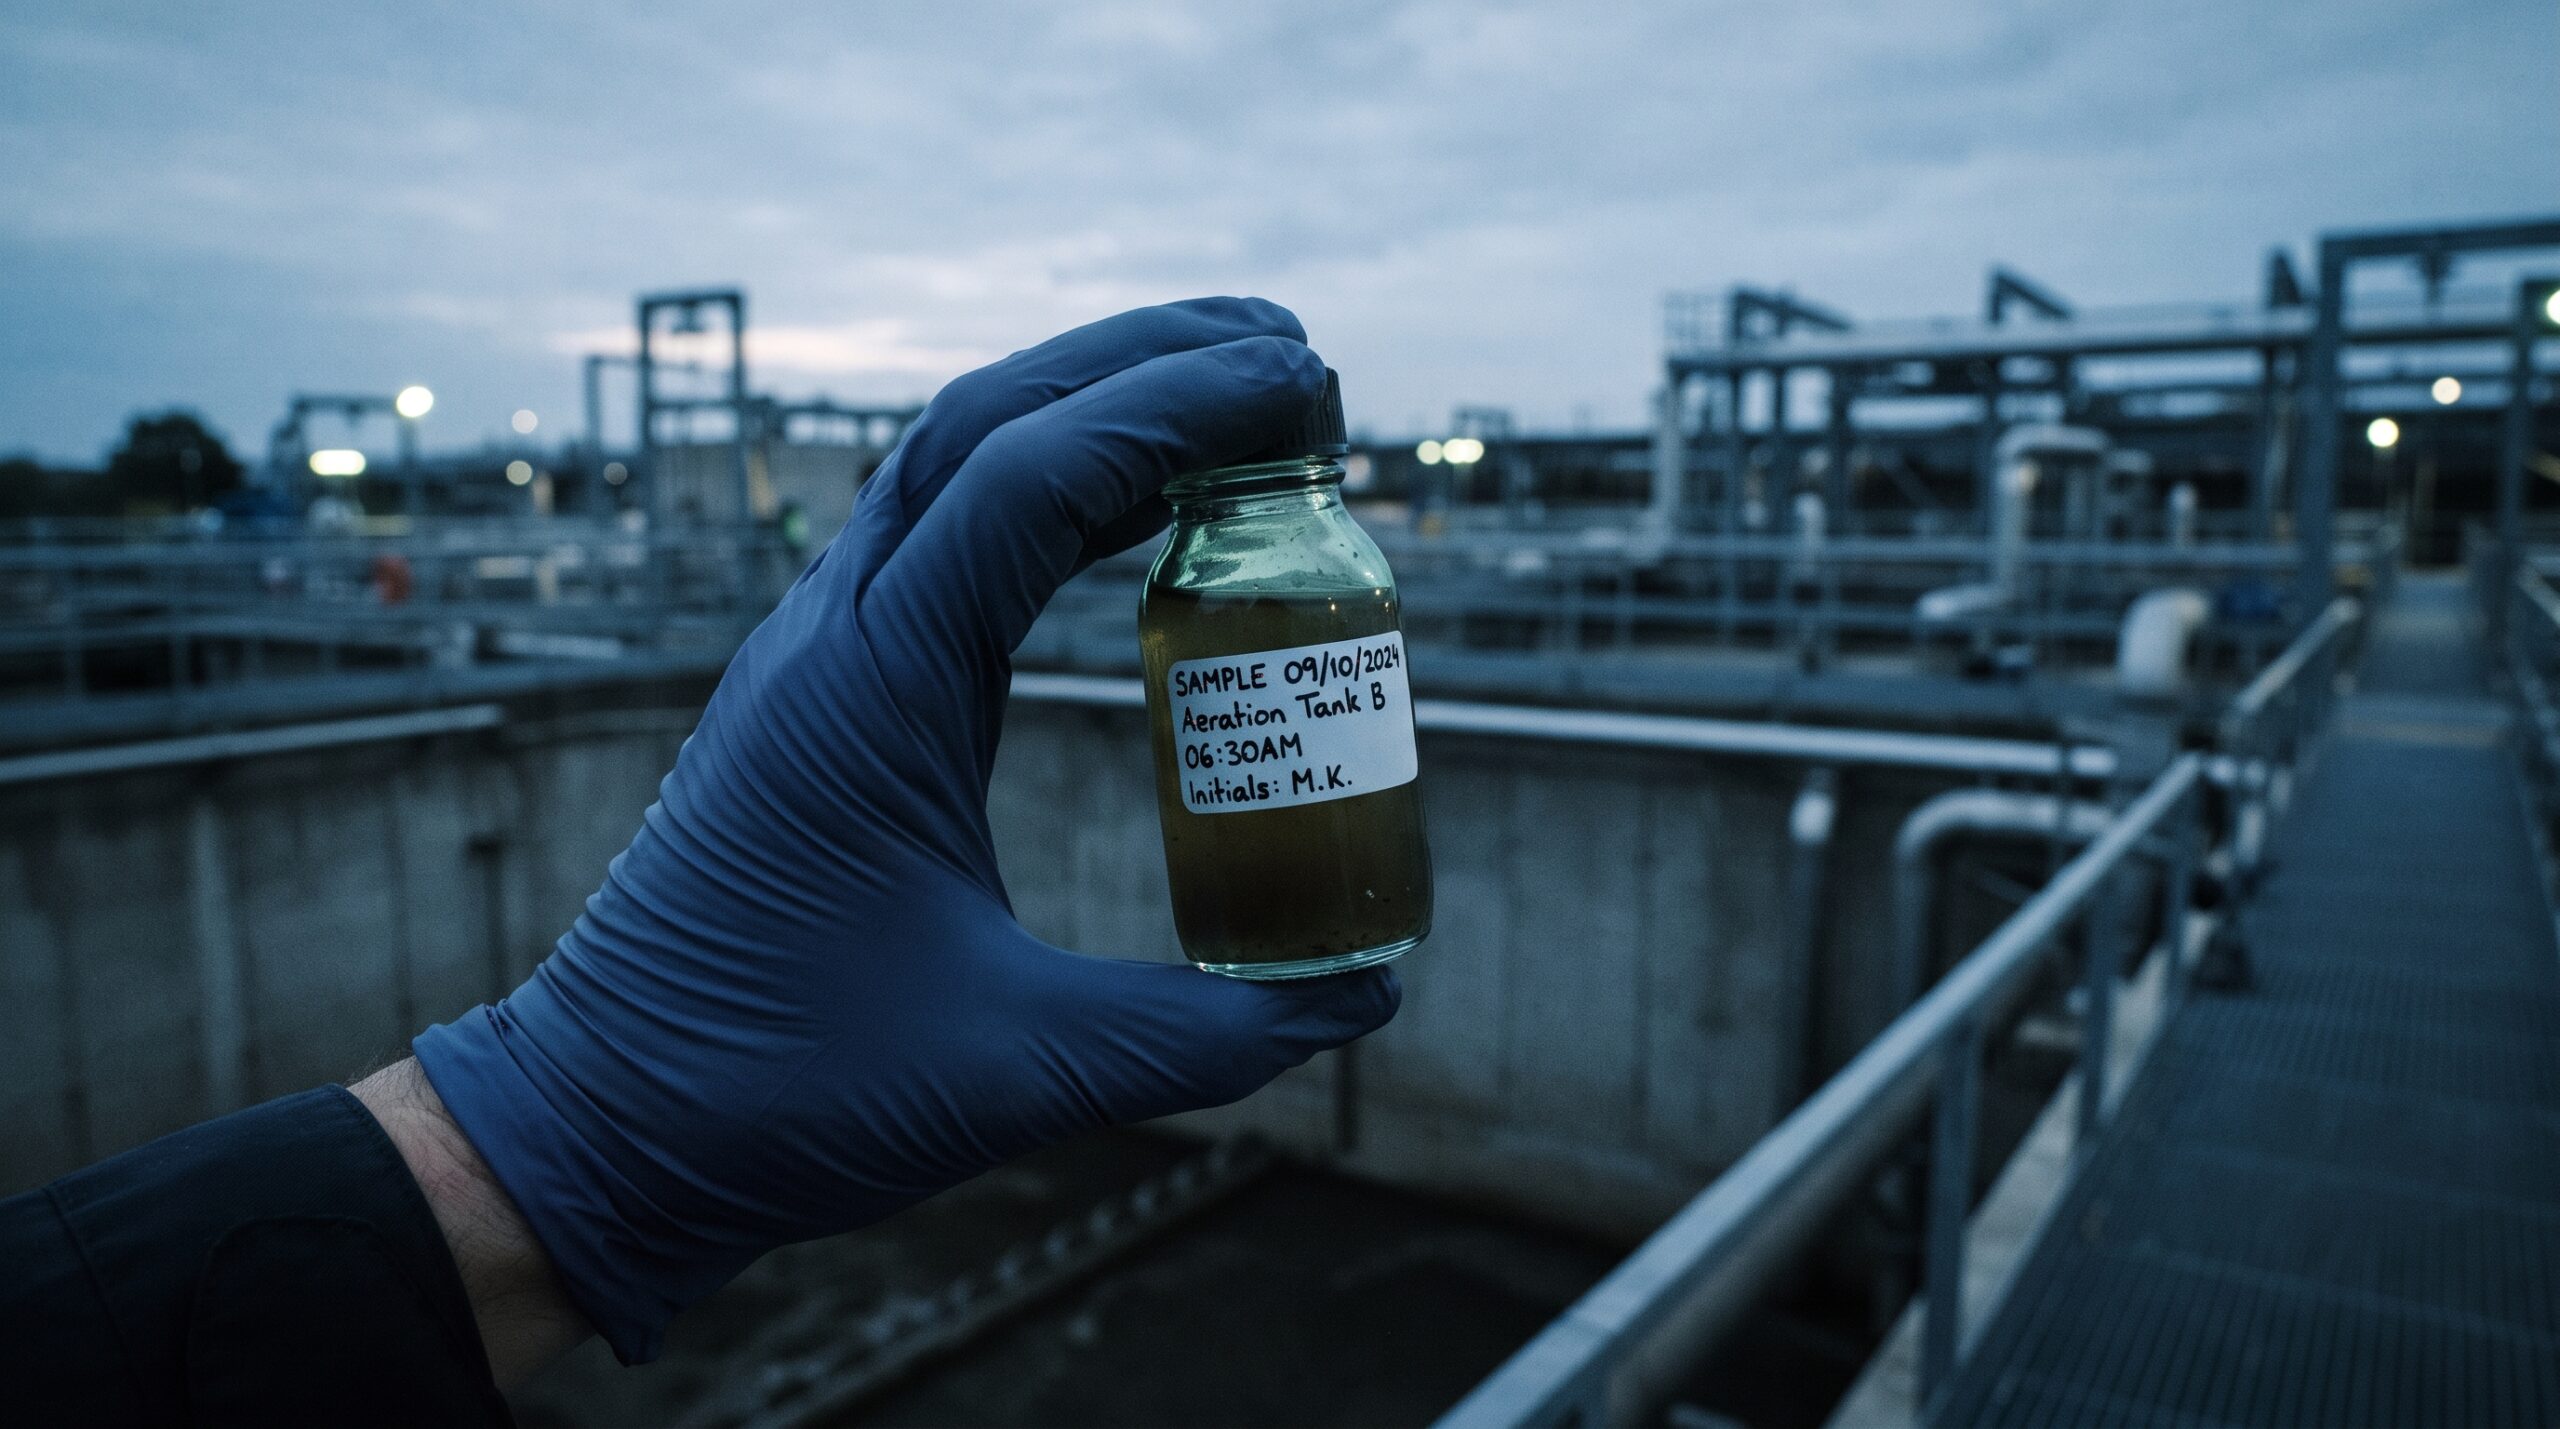
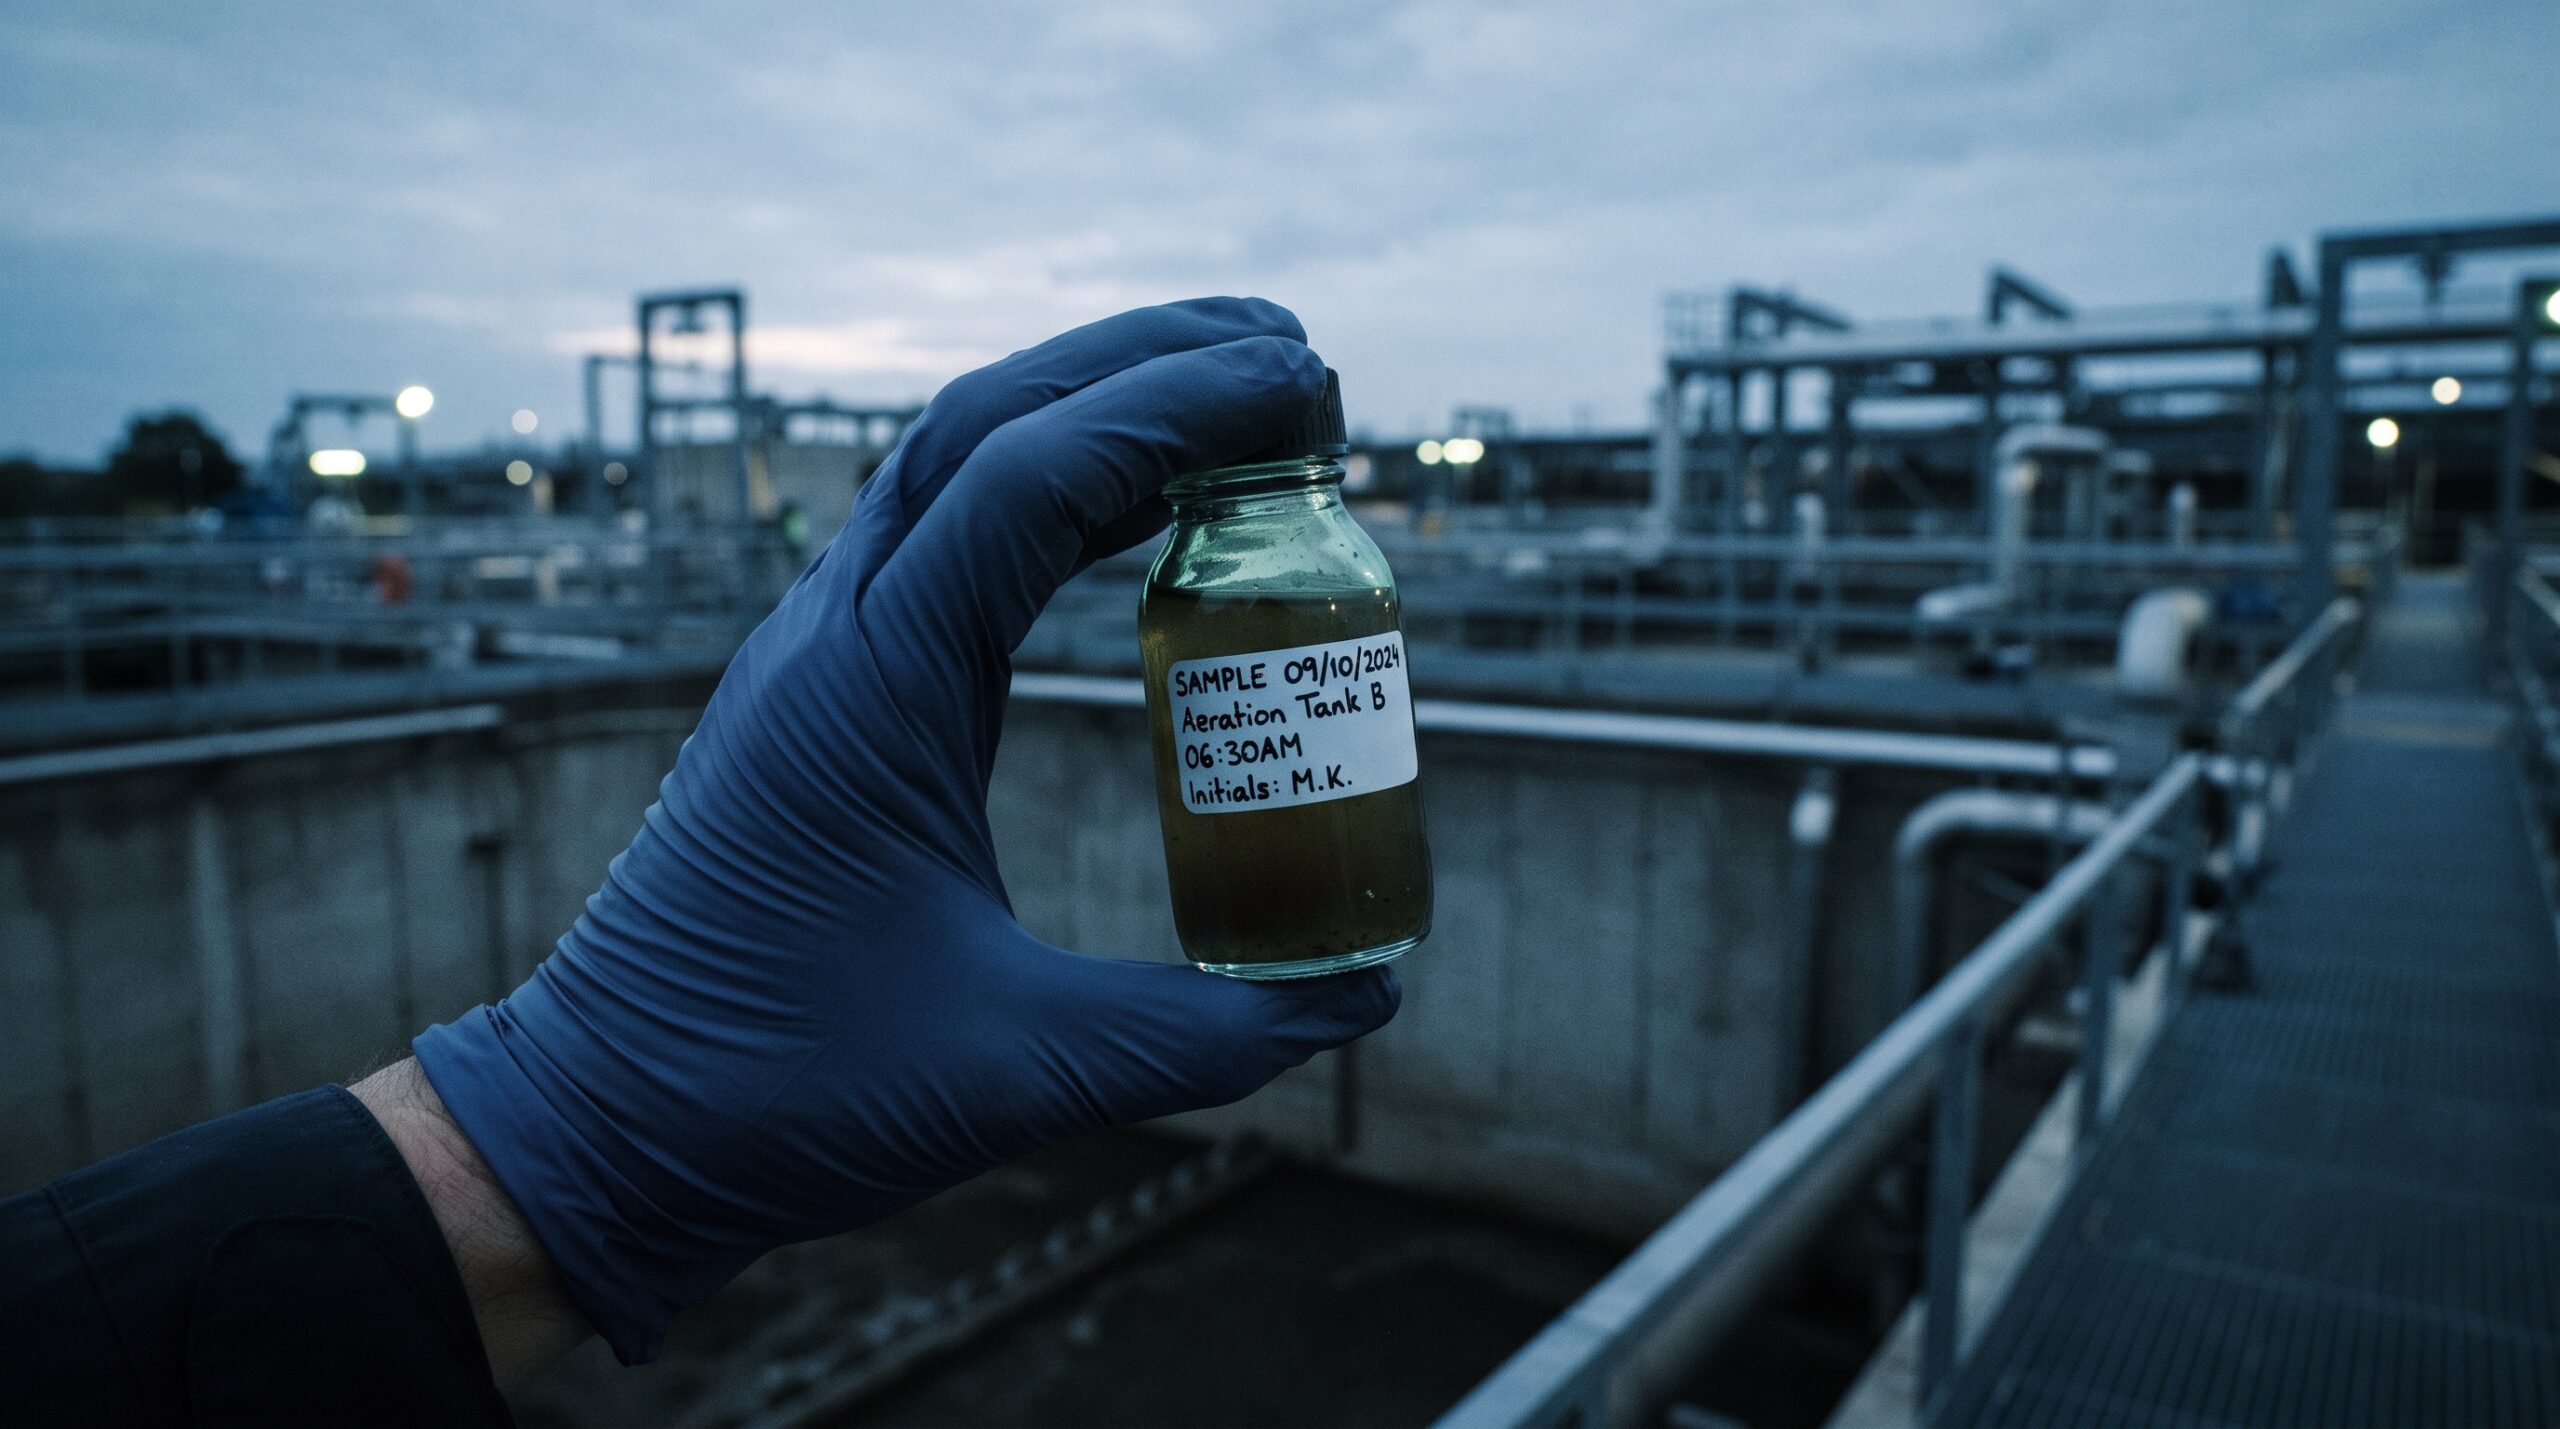
What the numbers mean. When someone uses cannabis, their body turns the THC into a residue called THC-COOH, which is flushed into the sewer.
Scientists test each city's sewage and report how many milligrams of that residue arrive per day for every 1,000 residents.
It works like a "cannabis per head" score: the higher the number, the more cannabis the city consumes. Amsterdam's 194 is about 13 times Ankara's 15.
Map: cannabis in wastewater across Europe, 2025
League table: which European city smokes the most weed?
| # | City | Country | 2025 score | 2024 score | Change | Population served |
|---|---|---|---|---|---|---|
| 1 | AmsterdamNetherlands | Netherlands | 194.1 | 319.5 | ▼ −39%decrease | 699,648 |
| 2 | ErfurtGermany | Germany | 178.5 | — | no 2024 data | 215,199 |
| 3 | BerlinGermanyTreatment-plant catchment | Germany | 172.7 | — | no 2024 data | 3,948,000 |
| 4 | HamburgGermany | Germany | 167.3 | — | no 2024 data | 2,050,000 |
| 5 | NurembergGermany | Germany | 159.0 | — | no 2024 data | 451,472 |
| 6 | MariborSlovenia | Slovenia | 154.2 | 65.0 | ▲ +137%increase | 129,000 |
| 7 | LjubljanaSlovenia | Slovenia | 152.8 | 90.2 | ▲ +69%increase | 284,266 |
| 8 | FrankfurtGermany | Germany | 150.9 | — | no 2024 data | 1,157,800 |
| 9 | Novo mestoSlovenia | Slovenia | 143.5 | 36.8 | ▲ +290%increase | 26,103 |
| 10 | OsloNorway | Norway | 143.2 | 163.1 | ▼ −12%decrease | 929,199 |
| 11 | EsbjergDenmark | Denmark | 137.1 | 111.2 | ▲ +23%increase | 61,865 |
| 12 | České BudějoviceCzechia | Czechia | 134.5 | 118.0 | ▲ +14%increase | 110,000 |
| 13 | BergenNorway | Norway | 132.6 | 132.7 | ● −0%stable | 117,976 |
| 14 | MagdeburgGermany | Germany | 131.7 | — | no 2024 data | 281,150 |
| 15 | MainzGermany | Germany | 130.6 | — | no 2024 data | 223,000 |
| 16 | HanoverGermany | Germany | 130.1 | — | no 2024 data | 793,400 |
| 17 | BarcelonaSpain | Spain | 126.6 | 220.7 | ▼ −43%decrease | 1,206,813 |
| 18 | LisbonPortugal | Portugal | 125.0 | 150.8 | ▼ −17%decrease | 426,964 |
| 19 | RotterdamNetherlands | Netherlands | 124.6 | 148.0 | ▼ −16%decrease | 620,313 |
| 20 | MunichGermanyOne treatment plant (Gut Großlappen) | Germany | 114.8 | — | no 2024 data | 1,171,100 |
| 21 | DresdenGermany | Germany | 114.6 | — | no 2024 data | 671,806 |
| 22 | SplitCroatia2024 reading (4.93) looks anomalous; treat the change with caution | Croatia | 112.3 | 4.9 | ▲ +2178%increase | 109,710 |
| 23 | DublinIreland | Ireland | 106.4 | 98.1 | ● +8%stable | 1,980,000 |
| 24 | VelenjeSlovenia | Slovenia | 105.4 | 68.2 | ▲ +55%increase | 32,959 |
| 25 | NieuwgeinNetherlands | Netherlands | 102.0 | — | no 2024 data | 65,461 |
| 26 | EindhovenNetherlands | Netherlands | 98.2 | 124.6 | ▼ −21%decrease | 468,599 |
| 27 | AalborgDenmark | Denmark | 98.0 | 90.6 | ● +8%stable | 143,285 |
| 28 | CopenhagenDenmark | Denmark | 97.4 | 123.3 | ▼ −21%decrease | 662,529 |
| 29 | ParisFranceSeine Centre treatment plant only | France | 97.0 | 53.9 | ▲ +80%increase | 2,700,000 |
| 30 | RostockGermany | Germany | 96.6 | — | no 2024 data | 242,093 |
| 31 | BudapestHungary | Hungary | 93.5 | 56.8 | ▲ +65%increase | 912,698 |
| 32 | UtrechtNetherlands | Netherlands | 93.3 | 122.4 | ▼ −24%decrease | 274,295 |
| 33 | TrondheimNorway | Norway | 92.6 | 110.8 | ▼ −16%decrease | 211,876 |
| 34 | PragueCzechia | Czechia | 92.2 | 80.3 | ▲ +15%increase | 1,212,000 |
| 35 | Domžale-KamnikSlovenia | Slovenia | 91.9 | 46.6 | ▲ +97%increase | 81,400 |
| 36 | PlzeňCzechia | Czechia | 90.7 | 105.4 | ▼ −14%decrease | 178,677 |
| 37 | KranjSlovenia | Slovenia | 89.1 | 45.6 | ▲ +95%increase | 65,000 |
| 38 | BratislavaSlovakiaCentral treatment plant | Slovakia | 87.1 | 58.5 | ▲ +49%increase | 450,000 |
| 39 | OdenseDenmark | Denmark | 86.7 | 78.4 | ▲ +11%increase | 135,014 |
| 40 | StuttgartGermany | Germany | 83.0 | — | no 2024 data | 609,000 |
| 41 | AlmadaPortugal | Portugal | 80.0 | 119.1 | ▼ −33%decrease | 138,685 |
| 42 | ViennaAustria | Austria | 79.5 | 87.3 | ● −9%stable | 2,758,330 |
| 43 | SteyrAustria | Austria | 76.9 | 61.5 | ▲ +25%increase | 77,512 |
| 44 | ChemnitzGermany | Germany | 74.9 | — | no 2024 data | 239,402 |
| 45 | Santiago de CompostelaSpain | Spain | 74.5 | 54.3 | ▲ +37%increase | 136,500 |
| 46 | BrnoCzechia | Czechia | 73.1 | 72.3 | ● +1%stable | 445,000 |
| 47 | PiešťanySlovakia | Slovakia | 72.3 | 52.3 | ▲ +38%increase | 35,000 |
| 48 | Karlovy VaryCzechia | Czechia | 71.8 | 72.0 | ● −0%stable | 67,544 |
| 49 | NæstvedDenmark | Denmark | 69.7 | 93.5 | ▼ −26%decrease | 70,094 |
| 50 | KufsteinAustria | Austria | 67.0 | 74.1 | ● −10%stable | 46,172 |
| 51 | Wiener NeustadtAustria | Austria | 63.0 | 55.9 | ▲ +13%increase | 138,435 |
| 52 | AarhusDenmark | Denmark | 59.9 | 65.5 | ● −9%stable | 131,038 |
| 53 | KapfenbergAustria | Austria | 57.2 | 53.5 | ● +7%stable | 36,287 |
| 54 | ZagrebCroatia | Croatia | 56.5 | 88.8 | ▼ −36%decrease | 650,000 |
| 55 | InnsbruckAustria | Austria | 53.8 | 79.0 | ▼ −32%decrease | 362,299 |
| 56 | BolzanoItaly | Italy | 53.3 | 52.7 | ● +1%stable | 259,084 |
| 57 | Hall-WattensAustria | Austria | 53.1 | 49.7 | ● +7%stable | 65,921 |
| 58 | GrazAustria | Austria | 51.7 | 66.2 | ▼ −22%decrease | 527,576 |
| 59 | StockholmSwedenThree treatment plants | Sweden | 50.3 | — | no 2024 data | 1,314,631 |
| 60 | HofsteigAustria | Austria | 48.3 | 55.9 | ▼ −13%decrease | 104,054 |
| 61 | CastellónSpain | Spain | 47.1 | 65.0 | ▼ −28%decrease | 186,324 |
| 62 | GuntramsdorfAustria | Austria | 45.5 | — | no 2024 data | 13,808 |
| 63 | KnittelfeldAustria | Austria | 45.5 | 39.0 | ▲ +17%increase | 38,925 |
| 64 | SalzburgAustria | Austria | 45.5 | 50.8 | ▼ −10%decrease | 485,745 |
| 65 | Ried im InnkreisAustria | Austria | 44.7 | 58.1 | ▼ −23%decrease | 22,463 |
| 66 | PortoPortugal | Portugal | 44.6 | 53.7 | ▼ −17%decrease | 150,000 |
| 67 | LleidaSpain | Spain | 42.9 | 121.3 | ▼ −65%decrease | 144,887 |
| 68 | MilanItaly | Italy | 42.0 | 52.3 | ▼ −20%decrease | 1,089,332 |
| 69 | KrakówPolandOne treatment plant (Płaszów) | Poland | 41.9 | 41.7 | ● +0%stable | 680,000 |
| 70 | WildonAustria | Austria | 40.9 | 31.3 | ▲ +31%increase | 86,528 |
| 71 | Nova GoricaSlovenia | Slovenia | 39.9 | — | no 2024 data | 24,558 |
| 72 | GävleSweden | Sweden | 37.5 | 44.8 | ▼ −16%decrease | 89,463 |
| 73 | Ústí nad LabemCzechia | Czechia | 35.2 | 47.7 | ▼ −26%decrease | 92,572 |
| 74 | KlagenfurtAustria | Austria | 34.2 | 42.8 | ▼ −20%decrease | 189,235 |
| 75 | Strass im ZillertalAustria | Austria | 34.2 | 32.0 | ● +7%stable | 111,647 |
| 76 | TrollhättanSweden | Sweden | 33.3 | 49.7 | ▼ −33%decrease | 59,004 |
| 77 | Millstätter SeeAustria | Austria | 28.6 | 25.8 | ▲ +11%increase | 82,207 |
| 78 | DebrecenHungary | Hungary | 25.7 | — | no 2024 data | 207,292 |
| 79 | HallstattAustria | Austria | 21.8 | — | no 2024 data | 15,124 |
| 80 | VäxjöSweden | Sweden | 21.2 | 46.9 | ▼ −55%decrease | 86,785 |
| 81 | IstanbulTürkiyeSix treatment plants | Türkiye | 16.8 | 16.5 | ● +2%stable | 16,525,000 |
| 82 | AnkaraTürkiye | Türkiye | 15.0 | 16.9 | ▼ −11%decrease | 5,108,556 |
Biggest year-on-year changes, 2024 to 2025
Biggest rises
- Split, Croatia: 4.9 → 112.3 +2178% (see note)
- Novo mesto, Slovenia: 36.8 → 143.5 +290%
- Maribor, Slovenia: 65.0 → 154.2 +137%
- Domžale-Kamnik, Slovenia: 46.6 → 91.9 +97%
- Kranj, Slovenia: 45.6 → 89.1 +95%
- Paris, France: 53.9 → 97.0 +80%
Biggest falls
- Lleida, Spain: 121.3 → 42.9 −65%
- Växjö, Sweden: 46.9 → 21.2 −55%
- Barcelona, Spain: 220.7 → 126.6 −43%
- Amsterdam, Netherlands: 319.5 → 194.1 −39%
- Zagreb, Croatia: 88.8 → 56.5 −36%
- Trollhättan, Sweden: 49.7 → 33.3 −33%
Split's 2024 reading of 4.9 was far below any other city's that year, so its +2,179% says more about that sample than about a real 23-fold rise. Overall, EUDA describes European cannabis loads as stable between 2024 and 2025: 21 cities rose, 28 fell and 14 were stable.
Country ranking (cities tested only)
| # | Country | Average score | Cities | Highest city |
|---|---|---|---|---|
| 1 | Germany | 147.9 | 13 | Erfurt (178.5) |
| 2 | Netherlands | 136.9 | 5 | Amsterdam (194.1) |
| 3 | Norway | 133.7 | 3 | Oslo (143.2) |
| 4 | Slovenia | 131.8 | 7 | Maribor (154.2) |
| 5 | Ireland | 106.4 | 1 | Dublin (106.4) |
| 6 | Spain | 106.3 | 4 | Barcelona (126.6) |
| 7 | Portugal | 99.4 | 3 | Lisbon (125.0) |
| 8 | France | 97.0 | 1 | Paris (97.0) |
| 9 | Denmark | 92.6 | 6 | Esbjerg (137.1) |
| 10 | Czechia | 87.1 | 6 | České Budějovice (134.5) |
| 11 | Slovakia | 86.1 | 2 | Bratislava (87.1) |
| 12 | Hungary | 80.9 | 2 | Budapest (93.5) |
| 13 | Austria | 65.2 | 18 | Vienna (79.5) |
| 14 | Croatia | 64.5 | 2 | Split (112.3) |
| 15 | Sweden | 47.3 | 4 | Stockholm (50.3) |
| 16 | Italy | 44.2 | 2 | Bolzano (53.3) |
| 17 | Poland | 41.9 | 1 | Kraków (41.9) |
| 18 | Türkiye | 16.4 | 2 | Istanbul (16.8) |
Average weighted by the population each treatment plant serves. It covers only the cities that took part, so it is not a national figure: Türkiye's two cities alone serve 21.6 million people, France is represented by one Paris treatment plant.
How to read this data
- What is measured. When people use cannabis, the body breaks THC down into THC-COOH, which ends up in sewage. Labs measure how much reaches each treatment plant per day and divide by the population it serves. Higher load means more cannabis consumed per head, not necessarily more users.
- One week per city. Most cities were sampled for seven consecutive days between March and May 2025. A festival, a dry week or a change in sampling can move a single reading a lot, which is why some year-on-year swings are large.
- Cannabis is the hardest drug to measure this way. Only a small share of THC is excreted as THC-COOH and EUDA says more research is needed. Use the figures to compare cities, not to estimate how many joints a city smokes.
- Some "cities" are one treatment plant. Paris, Munich and Kraków figures cover a single plant, not the whole city. Notes in the table flag these.
- No German trend yet. EUDA's 2026 release has no 2024 values for any German city, so Germany's year-on-year change after its April 2024 legalisation can't be read from this data.
Methodology
Source. All figures come from EUDA's European Drug Report 2026, source table EDR26-WW-1. It publishes the 2025 wastewater results of the SCORE network (Sewage analysis CORe group Europe), alongside each city's previous measurement.
What we included. Every cannabis (THC-COOH) row: 82 cities in 18 countries, ranked by their 2025 score.
Year-on-year changes. The percentages and the rising/falling/stable labels are EUDA's own. We checked that every percentage matches the two published scores.
City names. Tidied for readability. EUDA's site codes, such as "Berlin (IV)" or "Munich G", are kept in the CSV.
Country ranking. This is our calculation: the average of each country's city scores, weighted by the population each treatment plant serves.
Frequently asked questions
Which European city smokes the most weed?
Amsterdam. Its wastewater carried 194.1 mg of the cannabis metabolite THC-COOH per 1,000 people per day in spring 2025, the highest of 82 cities measured by the EU drugs agency (EUDA). That is still 39% lower than Amsterdam's 2024 reading of 319.5 mg. Erfurt (178.5), Berlin (172.7) and Hamburg (167.3) are next.
Which European country has the highest cannabis levels in wastewater?
Among the countries tested, Germany has the highest population-weighted average at 147.9 mg per 1,000 people per day across its 13 cities, followed by the Netherlands, Norway and Slovenia. 5 of the 8 highest-scoring cities are German. Country averages only cover the cities that took part, not whole countries.
Which European city has the lowest cannabis use in wastewater?
Ankara (15.0) and Istanbul (16.8) in Türkiye record the lowest loads, more than 10 times below Amsterdam. Inside the EU, the lowest readings are Växjö in Sweden (21.2) and Hallstatt in Austria (21.8).
Is cannabis use going up or down in European cities?
Overall it was flat. EUDA says total cannabis loads were stable between 2024 and 2025. Of the 63 cities with data for both years, 21 rose, 28 fell and 14 were stable (a change of under 10%). Big falls were recorded in Amsterdam, Barcelona and Lleida, while every Slovenian city with a comparison rose sharply.
Did Germany's 2024 legalisation increase cannabis use?
This dataset can't answer that. None of the 13 German cities has a 2024 comparison in EUDA's 2026 release, so there is no year-on-year change to report. German cities do rank very high in 2025: 5 of the top 8.
How accurate is wastewater analysis for cannabis?
It is a useful comparison between cities, but less precise for cannabis than for drugs such as cocaine. Only a small share of THC is excreted as THC-COOH, and EUDA says more research is needed. Each city is sampled for a single week, so one reading can swing. Wastewater measures how much is consumed, not how many people use it.


