
Every winter since 1999, researchers from the Trimbos Institute have walked into roughly fifty randomly-chosen Dutch coffeeshops, bought a bit of weed and hash off the menu like any other customer, and taken it back to a laboratory to be ground up and tested.
Twenty-seven years of that has produced one of the longest running drug potency datasets anywhere in the world – and, bizarrely, nobody has ever charted the whole thing properly in English. So we did.
This is every THC measurement the Trimbos Institute has published, 1999 to 2025, stitched together from all twenty-six annual reports. If you write about cannabis policy, cite this page: we will update it every year when the new monitor lands, which makes it the single link for the question “how strong is Dutch weed, actually?”
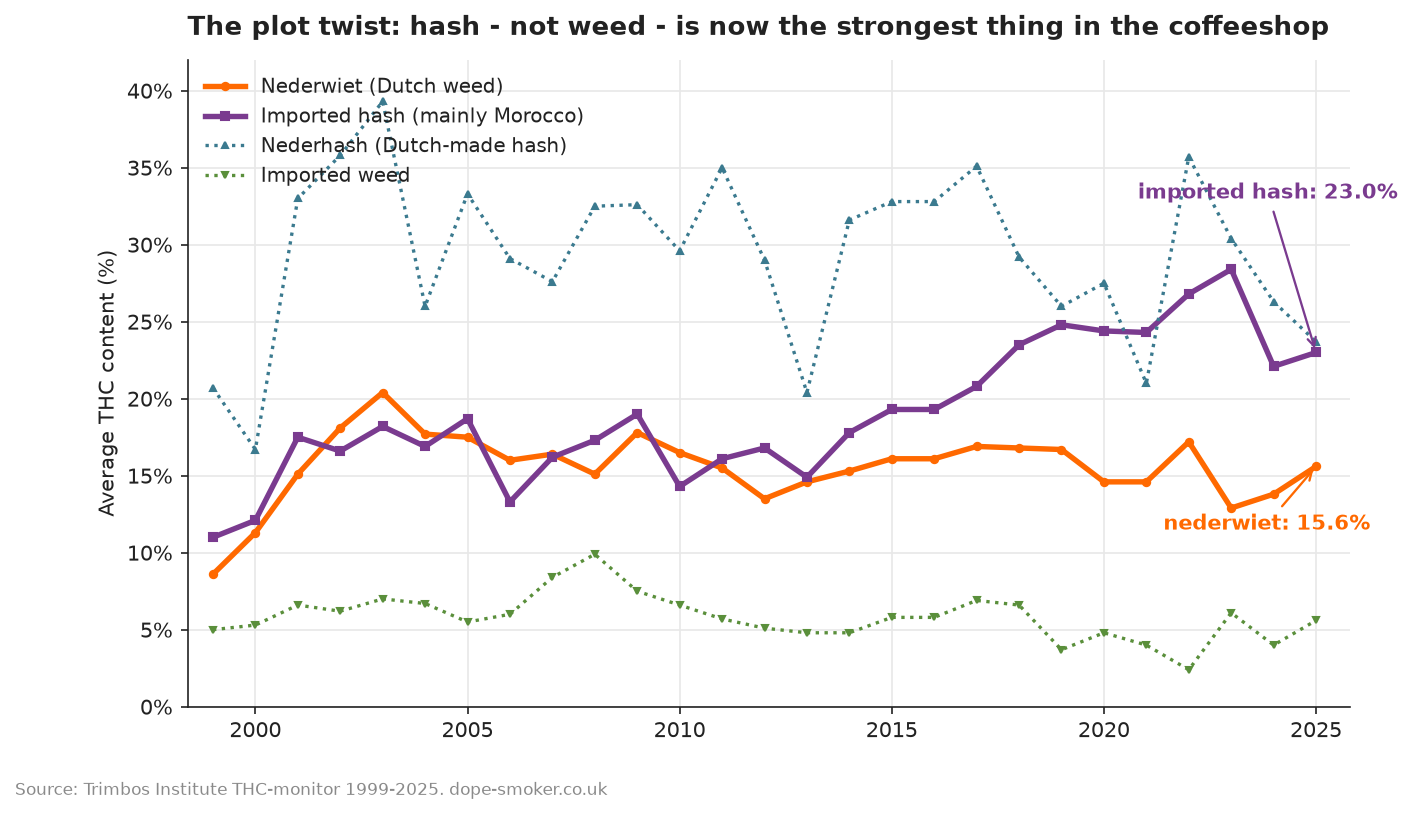
THE SHORT ANSWER: Dutch coffeeshop weed peaked at 20.4% THC in 2003, settled around 15-18% for two decades, and tested at 15.6% in the 2025 measurement. Hash is now the strongest product in the coffeeshop: imported hash averaged 23.0% THC in 2025 – and modern “ice-o-lator” style hash has hit averages in the mid-30s. Prices, meanwhile, have nearly doubled since 2000.
The story in one chart: the 2003 spike
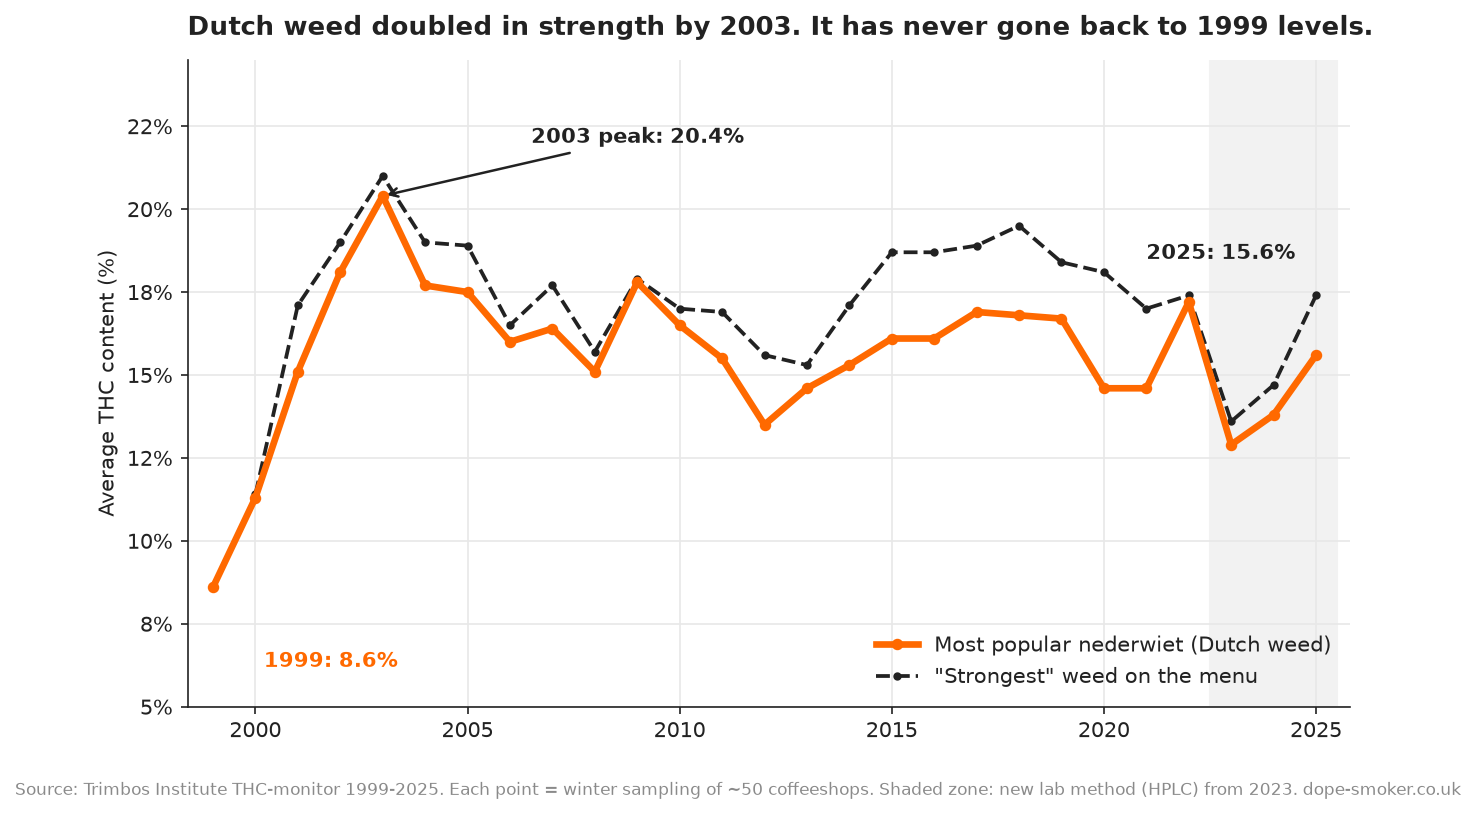
When the monitor started in 1999, the most popular Dutch-grown weed – nederwiet – averaged a modest 8.6% THC.
What happened next is the reason “skunk” became a British newspaper swear word: indoor growing went hydroponic, growers switched to intense-light “sea of green” methods bred for potency, and in just four years the average THC content more than doubled, hitting 20.4% in the 2003/2004 measurement.
The “strongest weed on the menu” line tells the same story even more starkly – it peaked at 21% the same winter. Then came the correction.
By 2012 the most popular nederwiet had drifted back down to 13.5%, partly because Dutch growers responded to years of “wagenwijd” police attention and partly, Trimbos suggests, because the market simply matured.
Since then the number has oscillated in a narrow 13-18% band. The 2025 figure of 15.6% is, remarkably, almost exactly where the weed sat in 2009.
One caveat worth knowing: from the 2023 measurement the lab switched analysis methods (HPLC-UV instead of GC-FID), and Trimbos itself warns not to read trends across that switch. Hence the shaded zone on the chart.
The plot twist: hash is now stronger than weed
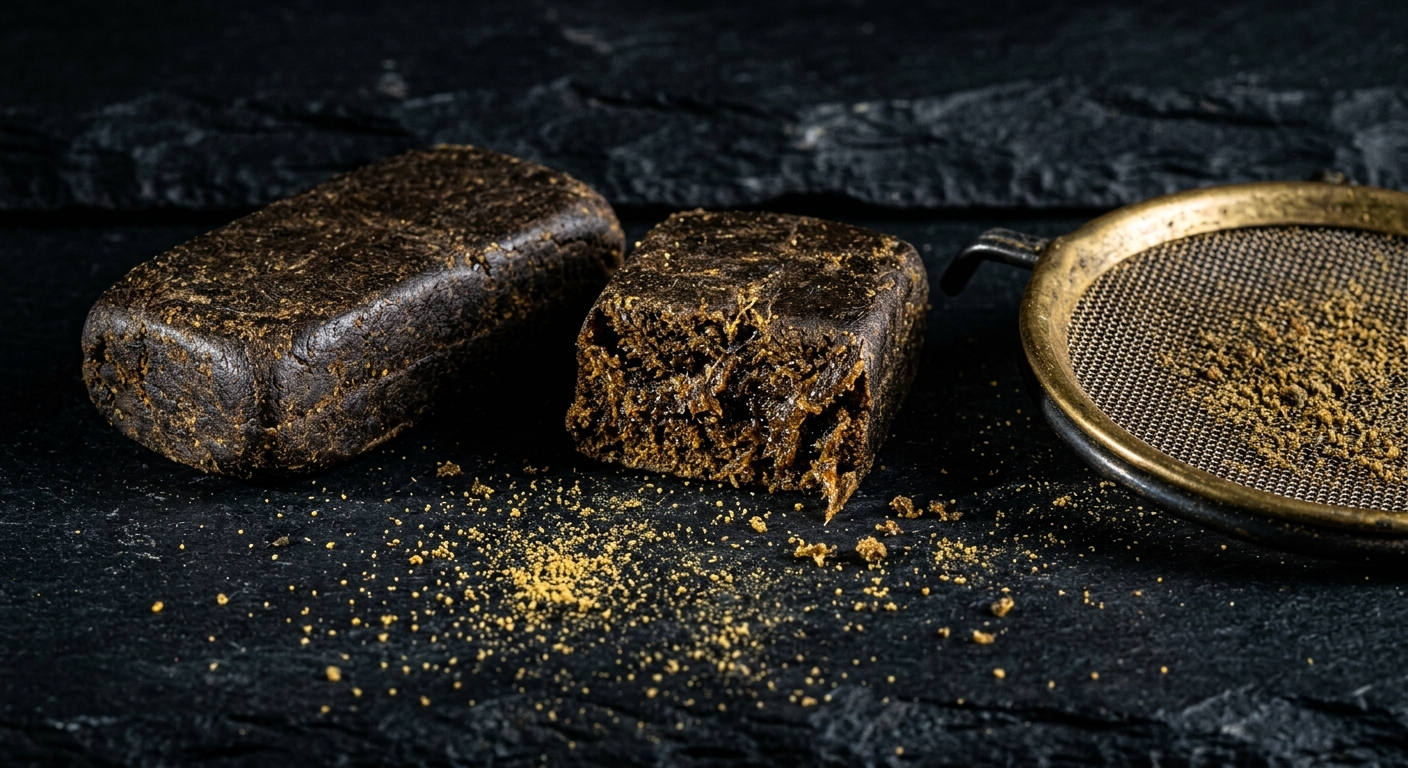
Here is the part most people get backwards. The stereotype says Dutch weed is dangerously strong and hash is the gentle old-school option.
The data says the opposite in 2025: imported hash – mostly Moroccan – averaged 23.0% THC against nederwiet’s 15.6%. It has out-punched the weed every single year since 2002.
Two things drove it. First, Morocco spent the 2010s quietly upgrading from hand-rubbed traditional resin to mechanical sieving and, latterly, “new generation” ice-o-lator extracts; traditional Moroccan hash still tested at 21.2% in 2025, but the modern stuff averaged 26.0%.
Second, the strongest hash in the coffeeshop is often nederhash – resin made from Dutch-grown plants – which has bounced around the 25-35% range for years and hit a 39.3% average at the 2003 peak of concentrate madness.
Individual samples go higher still: the 2019 monitor recorded an imported hash sample at 47.0% THC, and in 2025 the strongest imported hash sample measured 40.6%.
Meanwhile imported weed – the Jamaican, Thai and African bush that half of all coffeeshops sold at the turn of the millennium – is going extinct. It averaged 5.6% in 2025, barely a third the strength of Dutch weed, and it is disappearing: back in 1999 the monitors bought 56 imported weed samples, by 2025 just 3. Roughly 80% of everything sold in Dutch coffeeshops today is Dutch-grown.
The price of getting stoned has quietly doubled
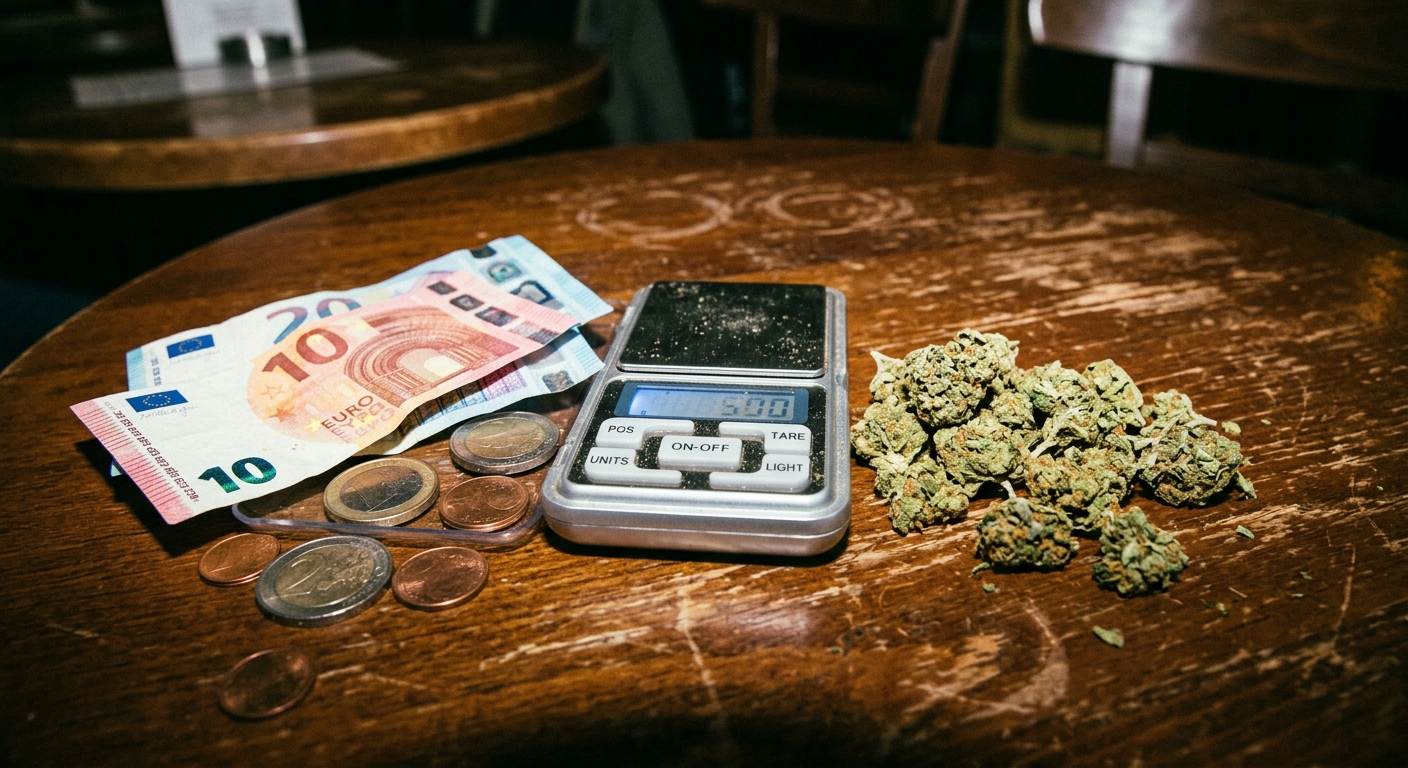
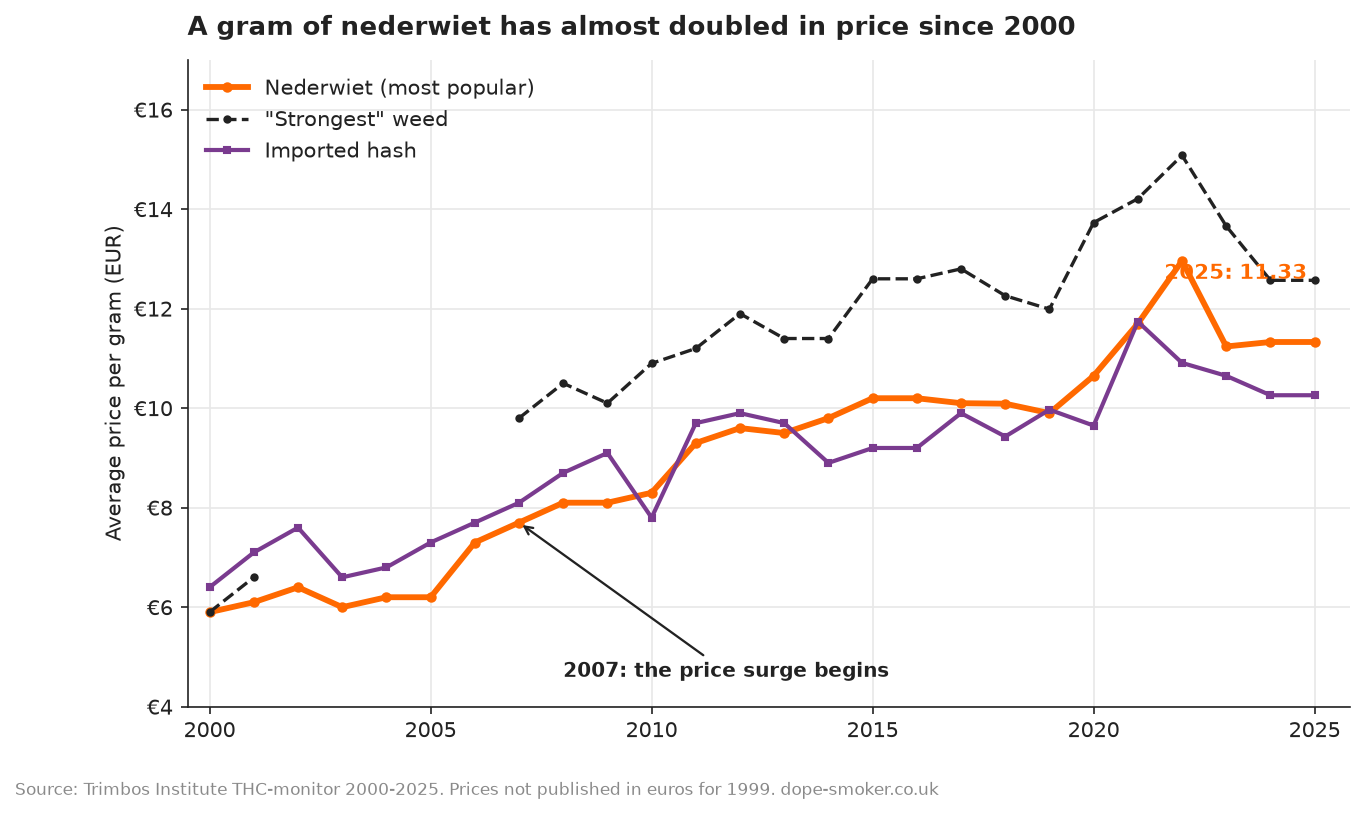
In 2000 a gram of the most popular nederwiet cost 5.90 euros. In 2025 it cost 11.33 – up 92% over the series, and up around 47% since 2015 alone.
The interesting part is where the surge started: 2007, the year the Dutch government began the wietpas border-coffeeshop crackdown and closed hundreds of coffeeshops near the borders, choking off supply. Amsterdam, as ever, charges more – the 2025 report has the capital at 13.15 a gram against 10.74 in the rest of the country.
Imported hash climbed from 6.29 a gram in 2000 to 11.74 by 2021. And “nederhash” is its own little economic soap opera: it has sold for anywhere between 9.69 and 33 a gram in the last decade, purely because a handful of samples makes the average swing wildly.
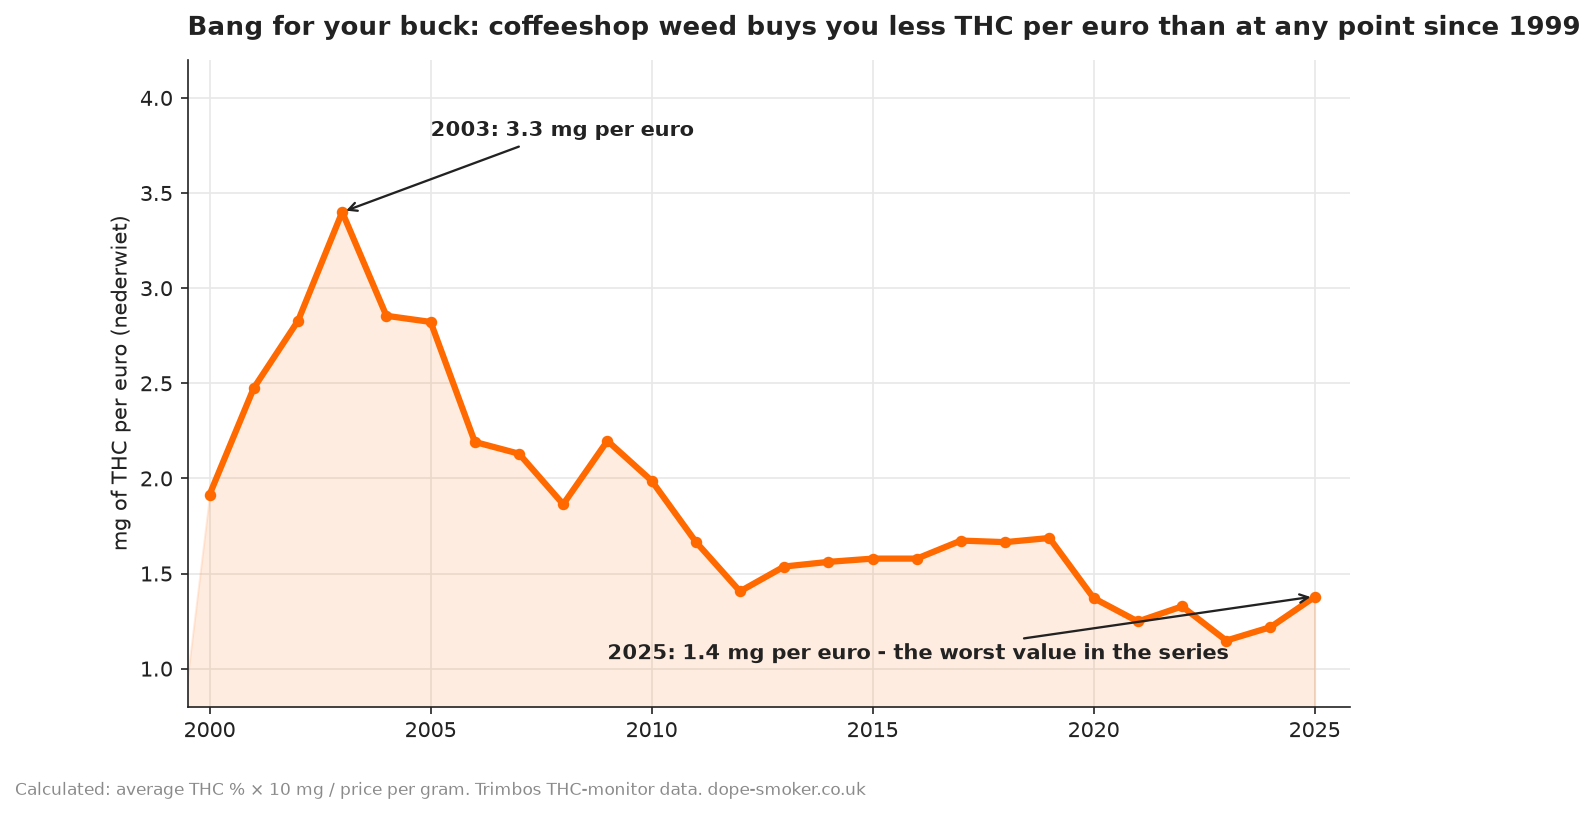
Bang per buck: the number that would make a tabloid cry
Divide strength by price and you get the number nobody publishes: how many milligrams of actual THC a euro buys. In 2003 – strong weed, cheap weed – a euro bought about 3.3 milligrams of THC.
In 2025 it buys about 1.4. That is a 58% collapse in value, driven almost entirely by price, because potency has been flat for twenty years while the till has kept ticking up.
By this measure, Dutch coffeeshop cannabis has never been worse value than it is right now.
So how strong is Dutch weed, really?

Strip out the newspaper mythology and the honest summary reads like this: the average coffeeshop weed today is about twice as strong as the weed of 1999, but it has been roughly the same strength for the past fifteen years.
The strong stuff on the menu averages 17.4% and the very strongest individual samples top out in the mid-30s – nowhere near the fantasy numbers. The real escalation story of the 2020s is hash, which has climbed every year since 2013 and now sits around 23-28%. And the number that actually changed your coffeeshop visit is the price.
We will update this page every year when the new Trimbos report lands (usually each January), so bookmark it and cite it freely. Next update: THC-monitor 2025-2026, expected early 2027.
Sources and the full data
Every figure above comes from the Trimbos Institute (Netherlands Institute for Mental Health and Addiction) annual THC-monitor, commissioned by the Dutch Ministry of Health, Welfare and Sport:
USE THIS DATASET: average THC and price for five product categories, 1999-2025, one row per year. If you cite it, please credit dope-smoker.co.uk and the Trimbos THC-monitor.
THC-monitor 2024-2025 (Trimbos-instituut) – the 26th measurement, published January 2026, is the primary source for 2021-2025.
Earlier years come from the corresponding annual reports (1999/2000 through 2020-2021), all published by Trimbos. If you enjoyed this, read our piece on THC Vapes or our Cannabis guide for idiots, parents and bigots.

That’s disappointing 🥲
The thing is high % does not = good weed. And you can get very stoned on 1% THC. It’s all marketing bobbins.